The Moving Average Convergence Divergence (MACD) is a widely used technical analysis indicator that helps traders identify changes in the strength, direction, momentum, and duration of a trend in a stock’s price. It is particularly valuable for its versatility and the depth of information it provides, making it an essential tool for both novice and experienced traders.
The MACD was developed by Gerald Appel in the late 1970s. Since its inception, it has become one of the most popular and trusted indicators in the trading community, thanks to its ability to provide clear signals in a variety of market conditions.

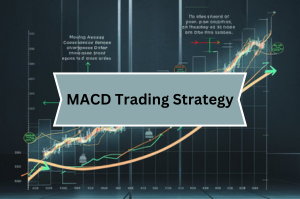
Deeper Understanding of the MACD
Components of MACD
The MACD consists of three main components: the MACD line, the signal line, and the MACD histogram. Understanding these components and how they interact is crucial for interpreting the signals generated by the MACD.
- MACD Line: This is calculated by subtracting the 26-period Exponential Moving Average (EMA) from the 12-period EMA. The MACD line represents the short-term momentum in relation to the long-term momentum.
- Signal Line: This is a 9-period EMA of the MACD line. It acts as a trigger for buy and sell signals. When the MACD line crosses above the signal line, it generates a bullish signal, and when it crosses below the signal line, it generates a bearish signal.
- MACD Histogram: The histogram is the graphical representation of the difference between the MACD line and the signal line. It helps traders visualize the strength and direction of the momentum. Positive histogram values indicate upward momentum, while negative values indicate downward momentum.

Interpreting MACD
MACD Crossovers
One of the primary signals provided by the MACD is the crossover between the MACD line and the signal line. bullish crossover occurs when the MACD line crosses above the signal line, suggesting it may be a good time to buy.
Conversely, a bearish crossover occurs when the MACD line crosses below the signal line, indicating it might be a good time to sell.
MACD Divergence and Convergence
Divergence occurs when the MACD and the stock price move in opposite directions. For example, if the price is making new highs but the MACD line is not, this is considered a bearish divergence and could indicate a potential reversal.
Convergence, on the other hand, occurs when both the price and the MACD are moving in the same direction, reinforcing the trend.
Using MACD in Trading Strategies
Trend Identification
The MACD is particularly effective for identifying the direction and strength of a trend. When the MACD line is above the signal line and both are above the zero line, it indicates a strong upward trend. Conversely, when the MACD line is below the signal line and both are below the zero line, it indicates a strong downward trend.
Signal Generation
Buy Signals
A buy signal is generated when the MACD line crosses above the signal line from below. This crossover suggests that the stock’s momentum is shifting upwards. For instance, if a stock’s MACD line crosses above the signal line after a period of decline, it may indicate the beginning of a new upward trend.
Sell Signals
A sell signal is generated when the MACD line crosses below the signal line from above. This crossover suggests that the stock’s momentum is shifting downwards. For example, if a stock’s MACD line crosses below the signal line after a period of ascent, it might signal the start of a downward trend.
Learn More About MACD
Practical Applications and Examples
Setting Up MACD on Charts
Using TradingView:
- Open a chart of the asset you wish to analyze on TradingView.
- Click on the “Indicators” button at the top of the chart.
- Search for “MACD” and select it from the list.
- The MACD will appear below your price chart. Adjust the settings if necessary to fit your trading strategy.
Read our full TradingView review.
Using TrendSpider:
- Open your chosen asset’s chart on TrendSpider.
- Click on the “Indicators” button and add the MACD.
- Customize the settings for the MACD to align with your specific trading preferences.
Read our detailed review of TrendSpider.
Real-Life Trading Scenarios
- Bullish Crossover Example: Imagine a stock that has been declining for several months. The MACD line crosses above the signal line, suggesting a potential reversal. If this crossover coincides with other indicators showing bullish signs, such as the RSI below 30, it might be a strong buy signal.
- Bearish Divergence Example: Consider a stock that has been rising steadily. However, the MACD line starts making lower highs while the stock price continues to rise. This bearish divergence can indicate a weakening trend and a potential sell signal.
Common Mistakes to Avoid
- Ignoring the Bigger Picture: Relying solely on the MACD without considering the broader market context can lead to false signals. Always confirm MACD signals with other technical indicators and fundamental analysis.
- Overreacting to Crossovers: Not all MACD crossovers are significant. It’s essential to use additional filters, such as volume or trend confirmation, to validate signals before acting.
Advanced Concepts and Strategies
Less Commonly Known Uses of MACD
While the MACD is widely known for its ability to generate buy and sell signals through crossovers, it also has several advanced applications. For example, traders can use the MACD histogram to measure the momentum of price movements.
When the histogram is increasing, it suggests that the bullish momentum is strengthening, while a decreasing histogram indicates weakening bullish momentum or strengthening bearish momentum.
Additionally, traders can look at the distance between the MACD line and the signal line. A widening gap suggests increasing strength in the trend, while a narrowing gap indicates a potential reversal.
Adjusting MACD Settings for Different Trading Environments and Assets
The default settings for MACD (12, 26, 9) are generally suitable for most trading scenarios. However, adjusting these settings can help tailor the MACD to different trading environments and assets. For instance, in highly volatile markets like cryptocurrencies, using shorter periods (e.g., 6, 13, 5) can make the MACD more responsive to quick price changes.
Conversely, for more stable markets, longer periods (e.g., 20, 50, 10) might be more appropriate, as they filter out noise and provide more reliable signals. Experimenting with different settings and backtesting them against historical data can help determine the most effective parameters for specific trading strategies.
Comparison and Integration
Compare MACD with Other Technical Indicators
RSI vs. MACD
While both the RSI and MACD are momentum indicators, they serve different purposes. The RSI measures the speed and change of price movements, indicating overbought or oversold conditions. In contrast, the MACD is more focused on the relationship between two EMAs and the momentum of price movements.
Combining RSI with MACD can provide a more comprehensive view of market conditions, helping traders avoid false signals.
Learn More About RSI Divergence
Stochastic Oscillator vs. MACD
The Stochastic Oscillator compares a particular closing price to a range of prices over a certain period, providing insights into the strength of the price movement. The MACD, on the other hand, focuses on the divergence and convergence of moving averages.
Using both indicators together can enhance trading decisions, with the Stochastic Oscillator highlighting potential reversal points and the MACD confirming the trend.
Bollinger Bands vs. MACD
Bollinger Bands measure market volatility and provide a dynamic range for price movements. The MACD helps identify the direction and strength of the trend. When combined, Bollinger Bands can indicate the volatility context in which the MACD signals occur, improving the reliability of the signals.
Integrating MACD into a Comprehensive Trading Toolkit
To effectively integrate the MACD into your trading toolkit, consider the following best practices:
- Use Multiple Timeframes: Analyze MACD signals across different timeframes to confirm trends and avoid false signals. For instance, if the MACD gives a bullish signal on both the daily and weekly charts, it is more likely to be reliable.
- Combine with Other Indicators: Use the MACD in conjunction with other indicators like RSI, Bollinger Bands, and support/resistance levels to validate signals and improve accuracy.
- Regularly Backtest: Continuously backtest your MACD-based strategies using historical data to ensure they remain effective in changing market conditions.
- Stay Informed: Keep abreast of market news and events that can impact price movements. The MACD can provide timely signals, but understanding the broader market context is essential for making informed trading decisions.
Check out some other momentum trading indicators.
Final Thoughts and Key Takeaways
The MACD is a versatile and powerful tool that can significantly enhance your trading strategies. By understanding its components and how to interpret its signals, you can effectively use the MACD to identify trends, generate buy and sell signals, and measure market momentum.
Integrating the MACD with other indicators and tools, such as TradingView and TrendSpider, can further improve your trading accuracy and confidence.
Key takeaways include:
- The MACD combines two EMAs and a signal line to provide insights into market momentum and trend strength.
- It is effective for generating buy and sell signals through crossovers and identifying potential reversals through divergence.
- Combining the MACD with other indicators like RSI and Bollinger Bands can enhance signal reliability.
- Adjusting MACD settings for different trading environments and regularly backtesting your strategies can optimize performance.
Frequently Asked Questions
The best timeframe depends on your trading style. Short-term traders might use the MACD on daily or hourly charts, while long-term traders might prefer weekly or monthly charts.
The MACD reacts quickly to market news due to its sensitivity to recent price changes. This makes it useful for capturing short-term shifts in momentum following major announcements.
Yes, combining MACD with other indicators like RSI, Bollinger Bands, and support/resistance levels can provide more comprehensive and reliable signals.
Tailor MACD settings by adjusting the time periods based on the asset’s volatility and trading volume. Shorter periods make the MACD more responsive, while longer periods help filter out noise.
The MACD can produce false signals in choppy markets and lags behind current price action. Using it with additional indicators and considering the broader market context can mitigate these limitations.
Backtesting involves using historical price data to evaluate the performance of your MACD-based strategies. Tools like TradingView and MetaTrader offer robust backtesting features to help you refine your approach before applying it in live markets.
Related Links
Source link

